Founded by data scientists and AI researchers, HR Signal™ uses predictive people analytics to help companies improve employee retention and talent development.
All data in this report is from HR Signal’s Workforce Insights Engine™
January 2022 to June 2023: Greater Cleveland Talent Insights Report
HR Signal is a trailblazer in AI-powered People Analytics, providing a platform to dramatically improve employee retention and talent development.
HR Signal’s proprietary Workforce Insights Engine contains billions of data points spanning career, market and public data. This report is a focus on the Greater Cleveland area to generate insights into regional talent trends across industries and employers.
Foundations and Framework
Report Objectives
This report aims to provide a comprehensive analysis of the so-called “white collar” workforce trends and insights in the Greater Cleveland Metro Area over an 18 month period. It is designed to be a valuable resource for local business leaders, human resource teams, and the media.
Overview of the Greater Cleveland Metro area workforce
The Greater Cleveland Metro Area is a vibrant economic hub, with a diverse population of over 2 million people. This report was generated by analyzing the majority of people within Greater Cleveland’s “white collar” workforce.
How was this report generated?
HR Signal’s Workforce Insights Engine™ is a large scale analysis system that leverages machine learning and AI to process a vast amount of workforce data. The goal is to generate an understanding and forecast of companies, people, industries and regions.
Data Sources
This report’s data comes from publicly available resumes and career profiles.
Scope of the Report
This report focuses on the “white collar” workforce in the Greater Cleveland Metro Area, comparing changes over an 18 month period from January 2022 to June 2023.
Methodology
The report employs quantitative analysis using data representing the majority. Data was processed and analyzed to derive insights into turnover, internal mobility, and positions.
Select Definitions
- Turnover – the aggregate of voluntary and involuntary employee departures from an organization.
- Internal Mobility – the movement of employees within an organization, encompassing promotions, lateral shifts, and demotions.
Turnover: Top 10 Companies
Top 10 Company Turnover Rates
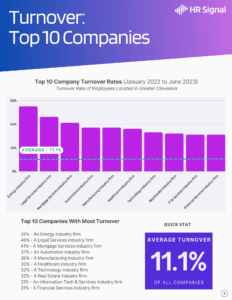
55% – An Energy industry firm
46% – A Legal Services industry firm
41% – A Mortgage Services industry firm
37% – An Automotive industry firm
36% – A Manufacturing industry firm
33% – A Healthcare industry firm
32% – A Technology industry firm
32% – A Real Estate industry firm
31% – An Information Tech & Services industry firm
31% – A Financial Services industry firm
Turnover: By Industry
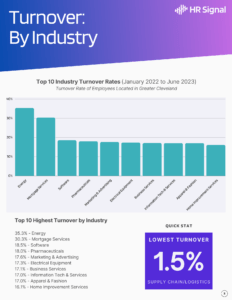
Top 10 Industry Turnover Rates
35.3% – Energy
30.3% – Mortgage Services
18.5% – Software
18.0% – Pharmaceuticals
17.6% – Marketing & Advertising
17.3% – Electrical Equipment
17.1% – Business Services
17.0% – Information Tech & Services
17.0% – Apparel & Fashion
16.1% – Home Improvement Services
Internal Mobility: Top 20 Companies
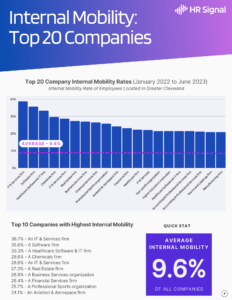
Top 10 Companies with Highest Internal Mobility
38.7% – An IT & Services firm
35.6% – A Software firm
33.3% – A Healthcare Software & IT firm
29.6% – A Chemicals firm
28.6% – An IT & Services firm
27.3% – A Real Estate firm
26.9% – A Business Services organization
26.4% – A Financial Services firm
25.7% – A Professional Sports organization
24.1% – An Aviation & Aerospace firm
Internal Mobility: By Industry
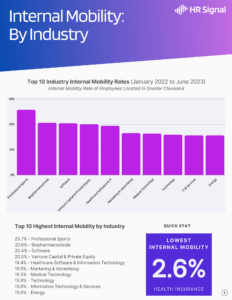
Top 10 Highest Internal Mobility by Industry
25.7% – Professional Sports
20.6% – Biopharmaceuticals
20.4% – Software
20.0% – Venture Capital & Private Equity
19.4% – Healthcare Software & Information Technology
16.5% – Marketing & Advertising
16.3% – Medical Technology
15.9% – Technology
15.6% – Information Technology & Services
15.6% – Energy
Position Trends: Most Growth
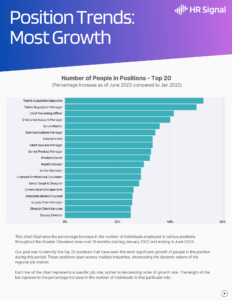
Number of People in Positions – Top 20
This chart illustrates the percentage increase in the number of individuals employed in various positions throughout the Greater Cleveland area over 18 months starting January 2022 and ending in June 2023.
Our goal was to identify the top 20 positions that have seen the most significant growth of people in the position during this period. These positions span across multiple industries, showcasing the dynamic nature of the regional job market.
Each bar of the chart represents a specific job role, sorted in descending order of growth rate. The length of the bar represents the percentage increase in the number of individuals in that particular role.
Position Trends: Most Turnover
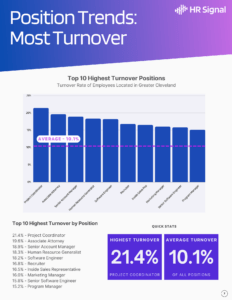
Top 10 Highest Turnover by Position
21.4% – Project Coordinator
19.6% – Associate Attorney
18.9% – Senior Account Manager
18.3% – Human Resource Generalist
18.2% – Software Engineer
16.8% – Recruiter
16.5% – Inside Sales Representative
16.0% – Marketing Manager
15.8% – Senior Software Engineer
15.2% – Program Manager
Position Trends: Most Internal Mobility
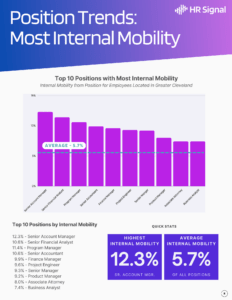
Top 10 Positions by Internal Mobility
12.3% – Senior Account Manager
10.6% – Senior Financial Analyst
11.4% – Program Manager
10.6% – Senior Accountant
9.9% – Finance Manager
9.6% – Project Engineer
9.3% – Senior Manager
9.2% – Product Manager
8.0% – Associate Attorney
7.4% – Business Analyst
What is HR Signal?
HR Signal™ is a software-as-a-service platform that works with any existing payroll, HRIS or ERP system.
HR Signal:
- Improves employee retention by predicting turnover
- Personalizes each employee’s career path options
- Illuminates workforce trends and forecasts outcomes
- Provides peer benchmarks and real market data
HR Signal’s Workforce Insights Engine™ processes billions of data points across millions of employers, regions and people.
Interested in improving employee retention and talent development at your organization?
Visit www.hrsignal.com
(888) 333 – 6755
[email protected]
hrsignal.com